I just came across an interview with Sue Grimmond, Professor of Physical Geography at King's College London. It is a very good summary of my blog posts so far. She presents an interesting table from one of her publications in the Geographical Journalin which she lists factors that contribute to the Urban Heat Island and measures for mitigation:
Climate change and its amplification in large cities as urban heat islands is a great concern for all of us. These phenomenons are happening and have life threatening potential for many people in the developing world. As nations keep failing to agree on regulations for greenhouse gas emissions the future does not look great.
The next few posts will explore the variety of action that is being taken to tackle climate change on an urban scale. To start with I want to warmly recommend a fellow bloggers site. When thinking about a city that is at the forefront in the struggle against climate change and has already built a community which is closest to be considered 'sustainable', most of us would probably come up with Copenhagen. And indeed, Copenhagen has the ambitious goal to become the first carbon neutral capital in the world. The Danish capital wants to be carbon neutral by 2025. In addition to cutting carbon emissions, investment in renewable energies will be boosted and more trees planted around the city. All of these goals want to be achieved without impeding economic growth. The Copenhagen Design Week in 2011 presented many ideas. One of them deals with the expected population growth of 100 000 by 2025. New housing must be provided, Copenhagen does not go for the cheap and easy solution. TheNorth Harbour is an excellent example of clever planning, it is one of the largest new urban development areas in Europe and will house 30 000 people. This city quarter is planned to be sustainable in every aspect. Other projects place family houses with attached gardens in inner city locations, watch this cnn reportor go for a swimin Copenhagen's old industrial harbour.
A very good resource on Green Copenhagen is provided by Anne Haugvaldstad in her Blog post Copenhagen: The First CO2 Neutral Capital. Follow her blog and you can also find out more about your personal climate impact and what you can do to stop the world from overheating.
Still to come...
How major cities around the globe work together to tackle climate change. Also, I want to run a special on my native Berlin and efforts to prevent climate change in the German capital.
This time it is all about the city I currently live in: London. R.L. Wilby at his time at King's College London published a paper in 2003 on London's urban heat island which will be reviewed in this post.
The UK Climate Impacts Programme (UKCIP) predicts an increase in solar radiation and a decrease in cloud cover over southern parts of the UK. More global radiation (see post Urban Heat Island) will warm the land surface. The largest urban area inside the EU, London is located within this area. As I discussed in the last post, urban regions disproportionally warm a lot faster during heatwaves. Will hot days become an increasing problem in the UK capital famous for its fog and rain?
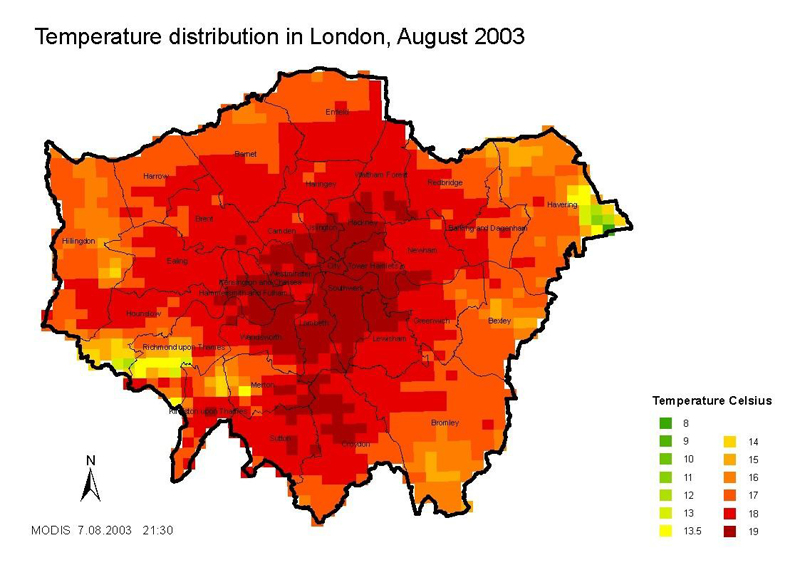
Over the summer of 1999 Wilby (2003) measured an average peak temperature difference between the British Museum and rural reference station Bracknell (30km to the west) of 3°C. London's Urban Heat Island (UHI) is strongest at night and it weakens with increasing wind speed. Figures 1 & 2 confirm a high night time (nocturnal) UHI which is strongest in inner city areas. Measurements representing Westminster (see Figure 1) were taken in St. James Park and therefore do not represent evening temperatures in built up areas which would be significantly higher as shown in Figure 2.
Figure 1: Hourly variation in London's Urban Heat Island with increasing distance from the city centre (British Museum) to a rural site 30km to the west (Bracknell): Westminster (~2km), Hammersmith (~6km), Kew (~13km) and Heathrow (~26km), during six days in July and August 1999 & 2000, source: Wilby, R.L. (2003)
Figure 2: London Heat Island on 07/08/2003 at 9:30 pm, Inner city areas are significantly warmer than outer regions, source: Website 1
London's UHI is strongest during summer where nocturnal averages reached 2.2°C in August of 1999. Whereas daytime UHI values were highest in December, however, their impact with 0.4°C on average is much less and can be attributed to anthropogenic heat production. From 1960 to 2000 the number of days with an UHI of 4°C or more (=intense UHI) has gone up by 4.4 days per decade. In the same time period the average nocturnal UHI during spring and summmer has gone up by 0.12°C per decade.
How will London's UHI develop in the future? Wilby (2003) created a model. [For all of you who are keen to understand the model, here are the variables included: near-surface wind strength, vorticity, relative humidity and 850 mb geopotential height. This combination gave a correlation coefficient of R=+0.6 for observed vesus modelled values.]He then took the medium-high greenhouse gas emissions scenario by the IPCC for future atmospheric composition. Under this scenario, Wilby expects an increase in intense UHI days by 15 days per year in the 2080s compared to the 1961-2000 average. He also modelled an intensification of the UHI by +0.26°C on average. All of this is on top of an expected warming of 3.5-4°C in southern parts of the UK (UKCIP). Considering that the summer UHI is much stronger than in the winter, London's city centre could become a very hot place by the 2080s. If Wilby (2003)'s model is correct, Inner London will experience less night-time relief during heatwaves and reduced cooling of the already at times unbearably warm underground system. And just imagine this lot...
...down here!
On this note we should start thinking about techniques that can be incorporated into the built environment of a city to reduce the UHI. The next post will explore how cities start to take measures against further warming. An interview with this blog's compagnion Professor Brian Stone Jr. on Public National Radio will feature as well.
This week's post is largely a review of chapter three in the book The City and the Coming Climate. Brian Stone introduces a study undertaken by his Urban Climate Lab to distinguish global warming due to greenhouse gases from the effects of the urban heat island. Stone (2012) takes us back to the year 1999. The Midwestern United States experienced a heat wave which led to the death of several hundreds of people. Figure 5 displays the temperature difference between the city of Chicago as well as the metropolitan area of St. Louis and their respective surrounding rural areas. The graph shows a mean difference of 1.1°C (2°F) to 1.7°C (3°F) for the week before the peak of the heat wave. During the last week of July 1999, the urban heat island intensified significantly. The average rural-urban temperature difference for St. Louis climbed to 2.8°C (5°F) and even up to 3.3°C (6°F) in Chicago for that week at the height of the heat wave. The temperature difference therefore doubled! Hence, urban areas have the potential to exacerbate extreme rural warming trends on the regional scale.
Figure 5: Urban-Rural Temperature Difference for 1999 Heat Wave, source: Website 1
Since cities make up not more than 3% of the global land surface (Stone, 2012) the effect of the urban heat island is largely neglected in global warming research. An increase in atmospheric greenhouse gases has led to increasing global temperatures after the onset of industrialisation. Weather stations around the world confirm this trend. Many of these weather stations are located in major cities. They are statistically adjusted to mirror rural conditions, the urban heat island effect is therefore artificially excluded. However, focussing only on warming due to greenhouse gases greatly underestimates warming on a regional scale in metropolitan areas. As mentioned above urban centres exacerbate the underlying warming due to greenhouse gases. Stone (2012) identifies a lack of knowledge on urban climates.
More people have died from heat stress than all other forms of extreme weather. It is therefore mandatory to get more data on the places half of the world's population lives in and where temperatures increase at a higher speed than anywhere else: our cities. Stone (2012) presents a study by the Urban Climate Lab in Atlanta, Georgia. The first problems arise when areas have to be identified as urban. Here, the night light intensity as measured from space (see Figure 6) is combined with population density data to distinguish an urban (bright lights) from a periurban (dim) and a rural place (dark).
Figure 6: Light Intensity at Night, source: Website 2
The urban heat island in the 50 most populous American metropolitan areas were monitored during a five-decade period, dating back to 1960 (see Stone, 2007 & Stone et al, 2012). Figure 7 gives an account of the rural (grey line) and urban (black line) temperature development from 1961-2010 in the US. The horizontal line at 0°F is the rural temperature average for this time period. The rural long term increase of about 0.8°C (1.4°F) is equivalent to global surface warming due to rising greenhouse gas concentrations in the atmosphere. The vertical distance between the grey and the black line represents the urban heat island. Stone et al (2012) have found an urban mean rate of warming over the 50-year period of 0.24°C (0.43°F) per decade. Rural areas warmed at a pace approximately one third less: 0.16°C (0.29°F) per decade. However 14 out of 50 cities did not show an intensifying urban heat island. These cities were largely older industrial cities with low sprawl indicies. Please read last week's post to find out about the relationship between a large sprawl of a city and its urban heat island. When only the 36 cities with a growing urban heat island are considered, the rate of warming is 0.31°C (0.56°F) and therefore double the rate of rural warming.
Figure 7: Urban-Rural Temperature Difference Over Past 50 Years, source: Stone et al (2012)
The urban heat island effect in the majority of US metropolitan areas has the same warming potential as the rise in greenhouse gases. Major cities may therefore continue to warm twice as fast as rural areas. Heat-related deaths could still increase and will most likely do so in the megacities of the global south. An increase of concrete and asphalt in urban settings must be balanced with more green spaces to let the city breathe. To look out for:
Beijing and Tokyo have been warming at rates five times greater than their rural surroundings in the past 50 years. In following posts I want to move away from the US for a bit and consider other continents and their urban heat islands. Architecture to counteract unwanted effects of urban warming are also still to come...
References
Stone, B. Jr. (2012), The City and the Coming Climate - Climate Change in the Places we live in. Cambridge University Press
Stone, B.Jr., Vargo, J., Habeeb, D. (2012) Managing climate change in cities: Will climate action plans work?, Landscape and Urban Planning, Vol. 107, No. 3, pp. 263-271
Stone, B.Jr. (2007) Urban and rural temperature trends in proximity to large U.S. cities: 1951-2000, International Journal of Climatology, Vol. 27, pp. 1801-1807
Website 1: http://mrcc.isws.illinois.edu/living_wx/heatwaves/heatwave1999.html (Midwestern Regional Climate Center, accessed 31/10/2012, 14:58)
In this post I want to sketch the history of urban climatology biefly and go into further detail on how urbanisation alters climate. Last week I purchased the book The City and the Coming Climate - Climate Change in the Places we live in written by Brian Stone Jr. who is the director of the Urban Climate Lab at Georgia Tech (http://www.urbanclimate.gatech.edu/). This week's post will be heavily influenced by his book as it is dedicated solely to urban climates and one of the very few publications on the topic.
The urban heat island effect had already been recognised in the Roman Empire. During the reign of Nero, commercial activity in the capital flourished. Roads were widened to accomodate increasing traffic. It became apparent that these roads got hotter during summer. It was then recommended that streets should be made narrow and houses high for shade to reduce air temperatures.
It was not until 1818 though that the term 'urban heat island' was first used by Luke Howard. The chemist recorded 3°C warmer air temperatures in London compared to its rural surroundings (Stone, 2012). He described 'an artificial excess of heat' in the city and linked it to industrial and domestic heat production (Jankovic et al, 2012).
The field of urban climatology experienced an important development in the 1960s. In the USA a series of 'new towns' were built from scratch to promote affordable housing with more social interaction. James W. Rouse designed Columbia, Maryland with innovative neighbourhood patterns whereby he clustered housing around public schools and small commercial districts. Furthermore, biking and walking trails were designed to reduce vehicle travel. The town was to be built in a rural area with low land prices. The urban climatologist Helmut Landsberg saw an opportunity to understand the urban heat island better and started to measure air temperature with the start of construction in Columbia. In the beginning, he recorded a temperature difference of 1°Cbetween the emerging town and its surroundings (Stone, 2012). In the next six years the population of Columbia grew rapidly from 1000 to 20 000. The urban-rural temperature difference after these six years was up to 7°C. This was the first time the urban heat island effect was so obviously proven.
Still today, research is undertaken to understand the effect of urban sprawl on climate. Stone et al (2010) used a sprawl index for 53 major American cities and climate data of Extreme Heat Events (EHEs). An EHE is defined as any day where the minimum, maximum or average air temperature is above the 85th percentile of the total temperature range in the years 1961 - 1990 in that city. Studies have shown that this is the threshold for a multitude of heat-related hospital admissions. Stone et al (2010) found that rapidly developing and sprawling cities (Phoenix or Atlanta) are more likely to experience extreme heat events than slower growing more compact cities (Boston or Chicago, see Figure 4).
Figure 4: Relationship between sprawl index and mean annual increase in frequency of Extreme Heat Events (EHEs), source: Stone (2012)
To look out for
The rapidly growing megacities in the developing world have a sprawl index much higher than the above mentioned American cities. The Urban Heat Island will contribute to high levels of warming in these already climate change vulnerable regions. The next blog post will examine the influence of the urban heat island in regional climates compared to the warming due to greenhouse gases.
References:
Jankovic, V. & Hebbert, M. (2012), Hidden Climate Change - Urban Meteorology and the Scales of Real Weather, Climatic Change, Vol. 113, pp. 23-33
Stone, B. Jr., Hess, J., Frumkin, H. (2010), Urban Form And Extreme Heat Events: Are Sprawling Cities More Vulnerable to Climate Change Than Compact Cities?, Environmental Health Perspectives, Vol. 118, pp. 1425-1428
Stone, B. Jr. (2012), The City and the Coming Climate - Climate Change in the Places we live in. Cambridge University Press
Urban structures have largely replaced natural soil
with impervious surfaces such as asphalt for road networks or concrete for
buildings. This impacts upon the natural energy distribution of incoming
radiation from the sun (global radiation,see Figure 1) on the Earth's surface. In natural settings a large
fraction of the global radiation is used to evaporate water, which is displayed
inFigure 1. Apart from the evaporation of water in lakes, rivers
or wetlands, vegetation transpires water through their pores which is then
evaporated. This combined effect of evapotranspirationleads to the displacement of heat away from the
Earth's surface into the atmosphere as the water vapour moves upwards. The
associated heat transfer is termedlatent heat,
latent as we cannot feel this heat on the Earth's surface. The energy used to
evaporate water, about 1888 Watt hours (Wh) as a global mean, is released again
when water vapour condensates as cloud droplets and warms the
atmosphere. Hence, even on a sunny summer day a meadow will not feel hot
due to latent heat. Evapotranspiration influences the amount of longwave
thermal radiation by regulating surface temperatures. The warmer the surface
the more thermal radiation will be generated. In the natural environment 38
percent of global radiation is directly converted to thermal radiation (Blanco
et al, 2011). It can then be absorbed by clouds and greenhouse
gases in the atmosphere.
Figure 1. Mean Global Radiation Balance on 1m² per
day. Source: Blanco et al (2011)
Urban structures have altered this natural heat
balance locally. Due to the sealing off of vegetated land, evapotranspiration
is cut down substantially.Figure 2shows the energy balance for an asphalt roof. Here,
latent heat accounts for only 123 Wh. A significantly higher fraction (1827 Wh)
of global radiation is converted intosensible heat, sensible as we can feel the heat on the Earth's
surface. Most of this heat is stored in the impervious surfaces of the built
environment. The subsequent release and distribution of this energy varies
temporally. Hence, Zhou et al (2011) categorise
a land surface temperature and an air temperature component.
Dark impervious surfaces such as asphalt, concrete or
brick heat up when exposed to sunshine. As they do not store water, the energy
is transformed to sensible heat. Subsequently, the rise in surface temperatures
also increases thermal radiation (2923 Wh for an asphalt roof, see Figure 2). Remote sensing measures the
longwave radiation of these surfaces through infrared analysis and deduces land
surface temperatures (Website 3). Figure 3 displays the substantial
temperature differences between these artificial materials and the surrounding vegetation
for a summer day. Urban structures, such as highways and a high density city
centre are clearly visible. Air which is in contact with these impervious
surfaces is heated up. Moreover, high rise buildings in the city create a
greater friction on wind. Air movement is therefore restricted in the so-called
urban canyons. This leads to higher air temperatures in the city compared to
its vegetated surroundings. However, an exception to this is formed by shadows
of high buildings which block sunlight. They prevent streets or other impervious
surfaces from being heated up as long as they are in the shade.
Figure 2: Asphalt roof, source: Blanco et al (2011)
Figure 2.Asphalt roof as daily mean. Source: Blanco et al (2011)
The air temperature component is caused by a more
indirect effect of the sun’s energy. Here, the rural-urban temperature gradient
is most pronounced at night. The large surface area of three-dimensional urban
structures over- and underground, not only releases high amounts of thermal
radiation but stores heat efficiently during hours of sunshine. Its high heat capacity
produces a large temperature gradient in between the artificial surfaces and the
soil. Subsequently, a steady heat flux is created. This energy flux into the
soil is two to three times larger in urban settings than in the natural
environment(Weischet et al, 2008). Energy is stored underground and released again when
the energy gradient reverses. This happens after sun set, when no more energy
is delivered by global radiation. The energy stored in the soil is gradually
released and warms the air in urban spaces substantially.Weischet et al (2008)measured a maximum difference of 10°C between the warm
city centre of Freiburg, Germany and its cooler surroundings for several summer
evenings. The annual average maximum was 2 - 3°C. The urban-rural air
temperature gradient is therefore greatest during a night following a day with
intense sunshine.
The increased warming of impervious surfaces and air
temperature in urban spaces compared to its rural surrounding is known as urban heat island (UHI).
The video below by the American Weather Channel (2009) illustrates some of the points made in this post. Moreover, it introduces techniques how the urban heat island may be counteracted. If these measures can be succesful will be the topic of posts to come...
To look out for
The increase in longwave radiation (compare Increase thermal radiation in Figures 1 & 2) in urban centres may play a significant role in enhancing the greenhouse effect globally. As urban centres spread rapidly, the influence of the urban heat island in the global climate system could increase dramatically.
Bibliography:
Blake, R., Grimm, A., Ichinose, T., Horton, R., Gaffin, S., Jiong, S., Bader, D., Cecil, L.D. (2011), Urban Climate: Processes, trends, and projections. Climate Change and Cities: First Assessment Report of the Urban Climate Change Research Network, Rosenzweig, C., Solecki, W.D., Hammer, S.A., Mehrotra, S., Eds., Cambridge University Press, UK, pp. 43-81
Blanco, H., McCarney, P., Parnell, S., Schmidt, M., Seot, K.C. (2011): The role of urban land in climate change. Climate Change and Cities: First Assessment Report of the Urban Climate Change Research Network, Rosenzweig, C., Solecki, W.D., Hammer, S.A., Mehrotra, S., Eds., Cambridge University Press, UK, pp. 217-248
Weischet, W. & Endlicher, W. (2008): Einführung in die Allgemeine Klimatologie, 7. Auflage. Gebr. Borntraeger: Berlin, Stuttgart
Zhou, W. et al (2011) Does spatial configuration matter? Understanding the effects of land cover pattern on land surface temperature in urban landscapes, Landscape and Urban Planning, Vol. 102, pp.54 - 63
I am excited to create this blog about urban climates and their potentially changing nature. Having lived in major cities for the main part of my life, urban centres attract me towards exploring them with the geographical tools attained through my university courses. With this blog I want to examine the microclimates created by urban structures and their effects on the global climate. Furthermore, I want to travel around the globe to discover modern architectural and technological solutions to this phenomenon.
I hope to generate interest for this topic and for your input to shape this blog.


.jpg) Figure
Figure 
